Ligands
This document describes how to work with ligands (molecules) and use them in Deep Origin tools.
There are two classes that help you work with ligands:
Constructing a Ligand or LigandSet
From a SDF file
A single Ligand can be constructed from a SDF file:
from deeporigin.drug_discovery import Ligand, BRD_DATA_DIR

ligand = Ligand.from_sdf(BRD_DATA_DIR / "brd-2.sdf")
To load a single-molecule SDF from org file storage, download and parse in one step with
Ligand.from_remote_file:
from deeporigin.drug_discovery import Ligand
from deeporigin.platform.client import DeepOriginClient

client = DeepOriginClient()
ligand = Ligand.from_remote_file("path/in/bucket/ligand.sdf", client=client)
A LigandSet can be constructed from a SDF File:
from deeporigin.drug_discovery import LigandSet, DATA_DIR

ligands = LigandSet.from_sdf(DATA_DIR / "ligands" / "ligands-brd-all.sdf")
A LigandSet can be constructed from multiple SDF files by concatenating them together:
from deeporigin.drug_discovery import LigandSet, DATA_DIR

# List of SDF file paths
sdf_files = [
    DATA_DIR / "ligands" / "ligands-brd-all.sdf",
    DATA_DIR / "ligands" / "42-ligands.sdf"
]

# Create LigandSet from multiple files
ligands = LigandSet.from_sdf_files(sdf_files)

# The resulting LigandSet contains all ligands from both files
print(f"Total ligands: {len(ligands)}")  # Should be 8 + 42 = 50
This is particularly useful when you have: - Multiple SDF files from different experiments - Split datasets that you want to combine - Files from different sources that need to be merged
From SMILES string(s)
A ligand can be constructed from a SMILES string, which is a compact way to represent molecular structures:
from deeporigin.drug_discovery import Ligand

ligand = Ligand.from_smiles(
    smiles="c1ccccc1",
    name="Oxo",     # Optional name for the ligand
)
SMILES Validation
The constructor will raise an exception if the provided SMILES string is invalid or cannot be parsed into a valid molecule.
A LigandSet can be constructed from a list or set of SMILES strings:
from deeporigin.drug_discovery import LigandSet

smiles = {
    "C/C=C/Cn1cc(-c2cccc(C(=O)N(C)C)c2)c2cc[nH]c2c1=O",
    "C=CCCn1cc(-c2cccc(C(=O)N(C)C)c2)c2cc[nH]c2c1=O",
}

ligands = LigandSet.from_smiles(smiles)
From a Chemical Identifier
You can create a ligand from common chemical identifiers (like PubChem names, common names, or drug names). This is particularly useful when working with well-known biochemical molecules:
from deeporigin.drug_discovery import Ligand

# Create ligands from common biochemical names
atp = Ligand.from_identifier(
    identifier="ATP",
)

serotonin = Ligand.from_identifier(
    identifier="serotonin",
)
The from_identifier constructor:
- Accepts common chemical names and identifiers
- Automatically resolves the identifier to a molecular structure
- Creates a 3D conformation of the molecule
- Particularly useful for well-known biochemical molecules like:
- Nucleotides (ATP, ADP, GTP, etc.)
- Neurotransmitters (serotonin, dopamine, etc.)
- Drug molecules (by their generic names)
- Common metabolites and cofactors
Identifier Resolution
The constructor will attempt to resolve the identifier using chemical databases. If the identifier cannot be resolved, it will raise an exception.
From an RDKit Mol object
If you're working with RDKit molecules directly, you can create a Ligand from an RDKit Mol object:
from deeporigin.drug_discovery import Ligand
from rdkit import Chem

# Create an RDKit molecule
mol = Chem.MolFromSmiles("CCO")  # Ethanol

# Convert to a Ligand
ligand = Ligand.from_rdkit_mol(
    mol=mol,
    name="Ethanol",  # Optional name for the ligand
)
This is particularly useful when you're working with RDKit's molecular manipulation functions and want to convert the results into a Ligand for further processing or visualization.
You can also create a LigandSet from a list of RDKit molecules:
from deeporigin.drug_discovery import LigandSet
from rdkit import Chem

mols = [Chem.MolFromSmiles("CCO"), Chem.MolFromSmiles("CCCO")]
ligands = LigandSet.from_rdkit_mols(mols)
From a CSV file
You can also create a LigandSet from a CSV file containing SMILES strings and optional properties:
from deeporigin.drug_discovery import LigandSet, DATA_DIR

ligands = LigandSet.from_csv(
    file_path=DATA_DIR / "ligands" / "ligands.csv",
    smiles_column="SMILES"  # Optional, defaults to "smiles"
)
The method will:
- Read the CSV file using pandas
- Extract SMILES strings from the specified column
- Create a Ligand instance for each valid SMILES
- Store all other columns as properties in each Ligand instance
- Skip any rows with empty or invalid SMILES strings
Error Handling
The method will raise:
- FileNotFoundError if the CSV file does not exist
- DeepOriginException if the specified SMILES column is not found in the CSV file
From a directory
You can create a LigandSet from a directory containing SDF and CSV files:
from deeporigin.drug_discovery import LigandSet, BRD_DATA_DIR

ligands = LigandSet.from_dir(BRD_DATA_DIR)
This will read all .sdf and .csv files in the directory and combine them into a single LigandSet.
Filtering Top Poses
Deprecated: docking_step / Complex.docking
The docking_step module was removed; Complex.docking no longer exists. Prefer Docking for docking outputs.
When working with docking results, you often have multiple poses for the same molecule. The filter_top_poses() method helps you select only the best pose for each unique molecule:
# assuming poses comes from protein.dock() or Docking.run() / tool results (Complex.docking was removed)

# Filter to keep only the best pose per molecule (by binding energy)
best_poses = poses.filter_top_poses()

# Or filter by pose score instead
best_poses = poses.filter_top_poses(by_pose_score=True)
Creates New Object
The filter_top_poses() method creates a new LigandSet containing only the best pose for each unique molecule. The original LigandSet is not modified. By default, it selects poses by minimum binding energy, but you can use by_pose_score=True to select by maximum pose score instead.
Visualization
Jupyter notebook required
Visualizations such as these require this code to be run in a jupyter notebook. We recommend using these instructions to install Jupyter.
Browser support
These visualizations work best on Google Chrome. We are aware of issues on other browsers, especially Safari on macOS.
Ligands
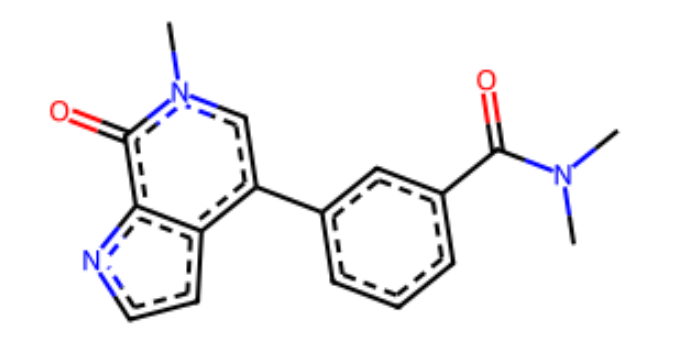
A ligand object can be visualized using show:
from deeporigin.drug_discovery import Ligand

ligand = Ligand.from_identifier("serotonin")

ligand.show()
A visualization similar to the following will be shown:
LigandSets
A LigandSet can be visualized using several different methods.
Summary card
Simply inspecting the LigandSet object shows the following:
ligands
LigandSet with 8 ligands
8 unique SMILES
Properties: initial_smiles, r_exp_dg
Use .to_dataframe() to convert to a dataframe, .show_df() to view dataframewith structures, or .show() for 3D visualization
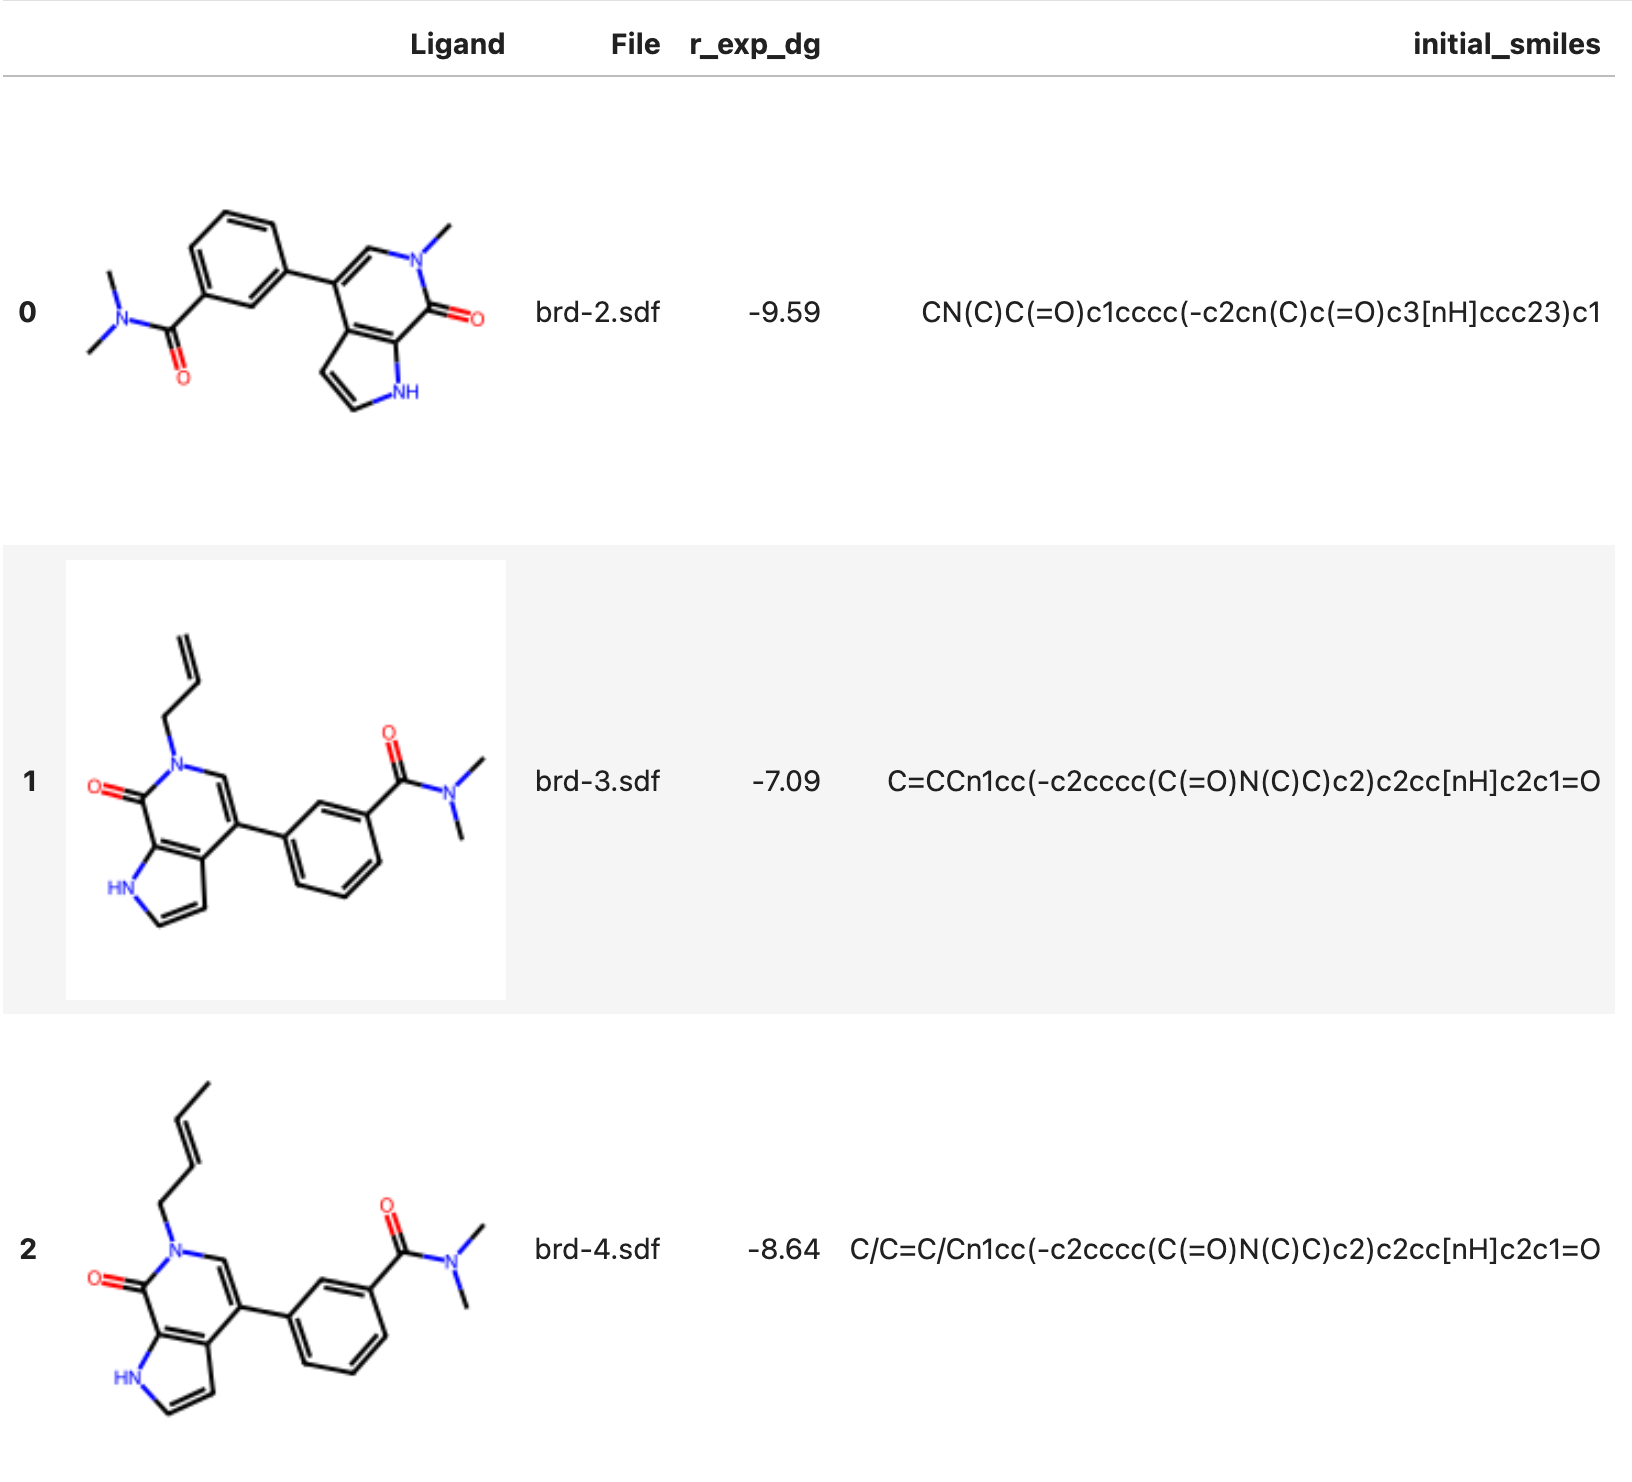
Table view (2D)
To view a dataframe containined rendered (2D) structures of ligands, use:
# for example
from deeporigin.drug_discovery import LigandSet, DATA_DIR

ligands = LigandSet.from_sdf(DATA_DIR / "ligands" / "ligands-brd-all.sdf")
ligands.show_df()
Expected Output
Individual view (3D)
To view 3D structures of all ligands in a LigandSet, use:
from deeporigin.drug_discovery import LigandSet, DATA_DIR

ligands = LigandSet.from_sdf(DATA_DIR / "ligands" / "ligands-brd-all.sdf")
ligands.show()
A visualization similar to this will be shown. Use the arrows to switch between Ligands in the LigandSet.
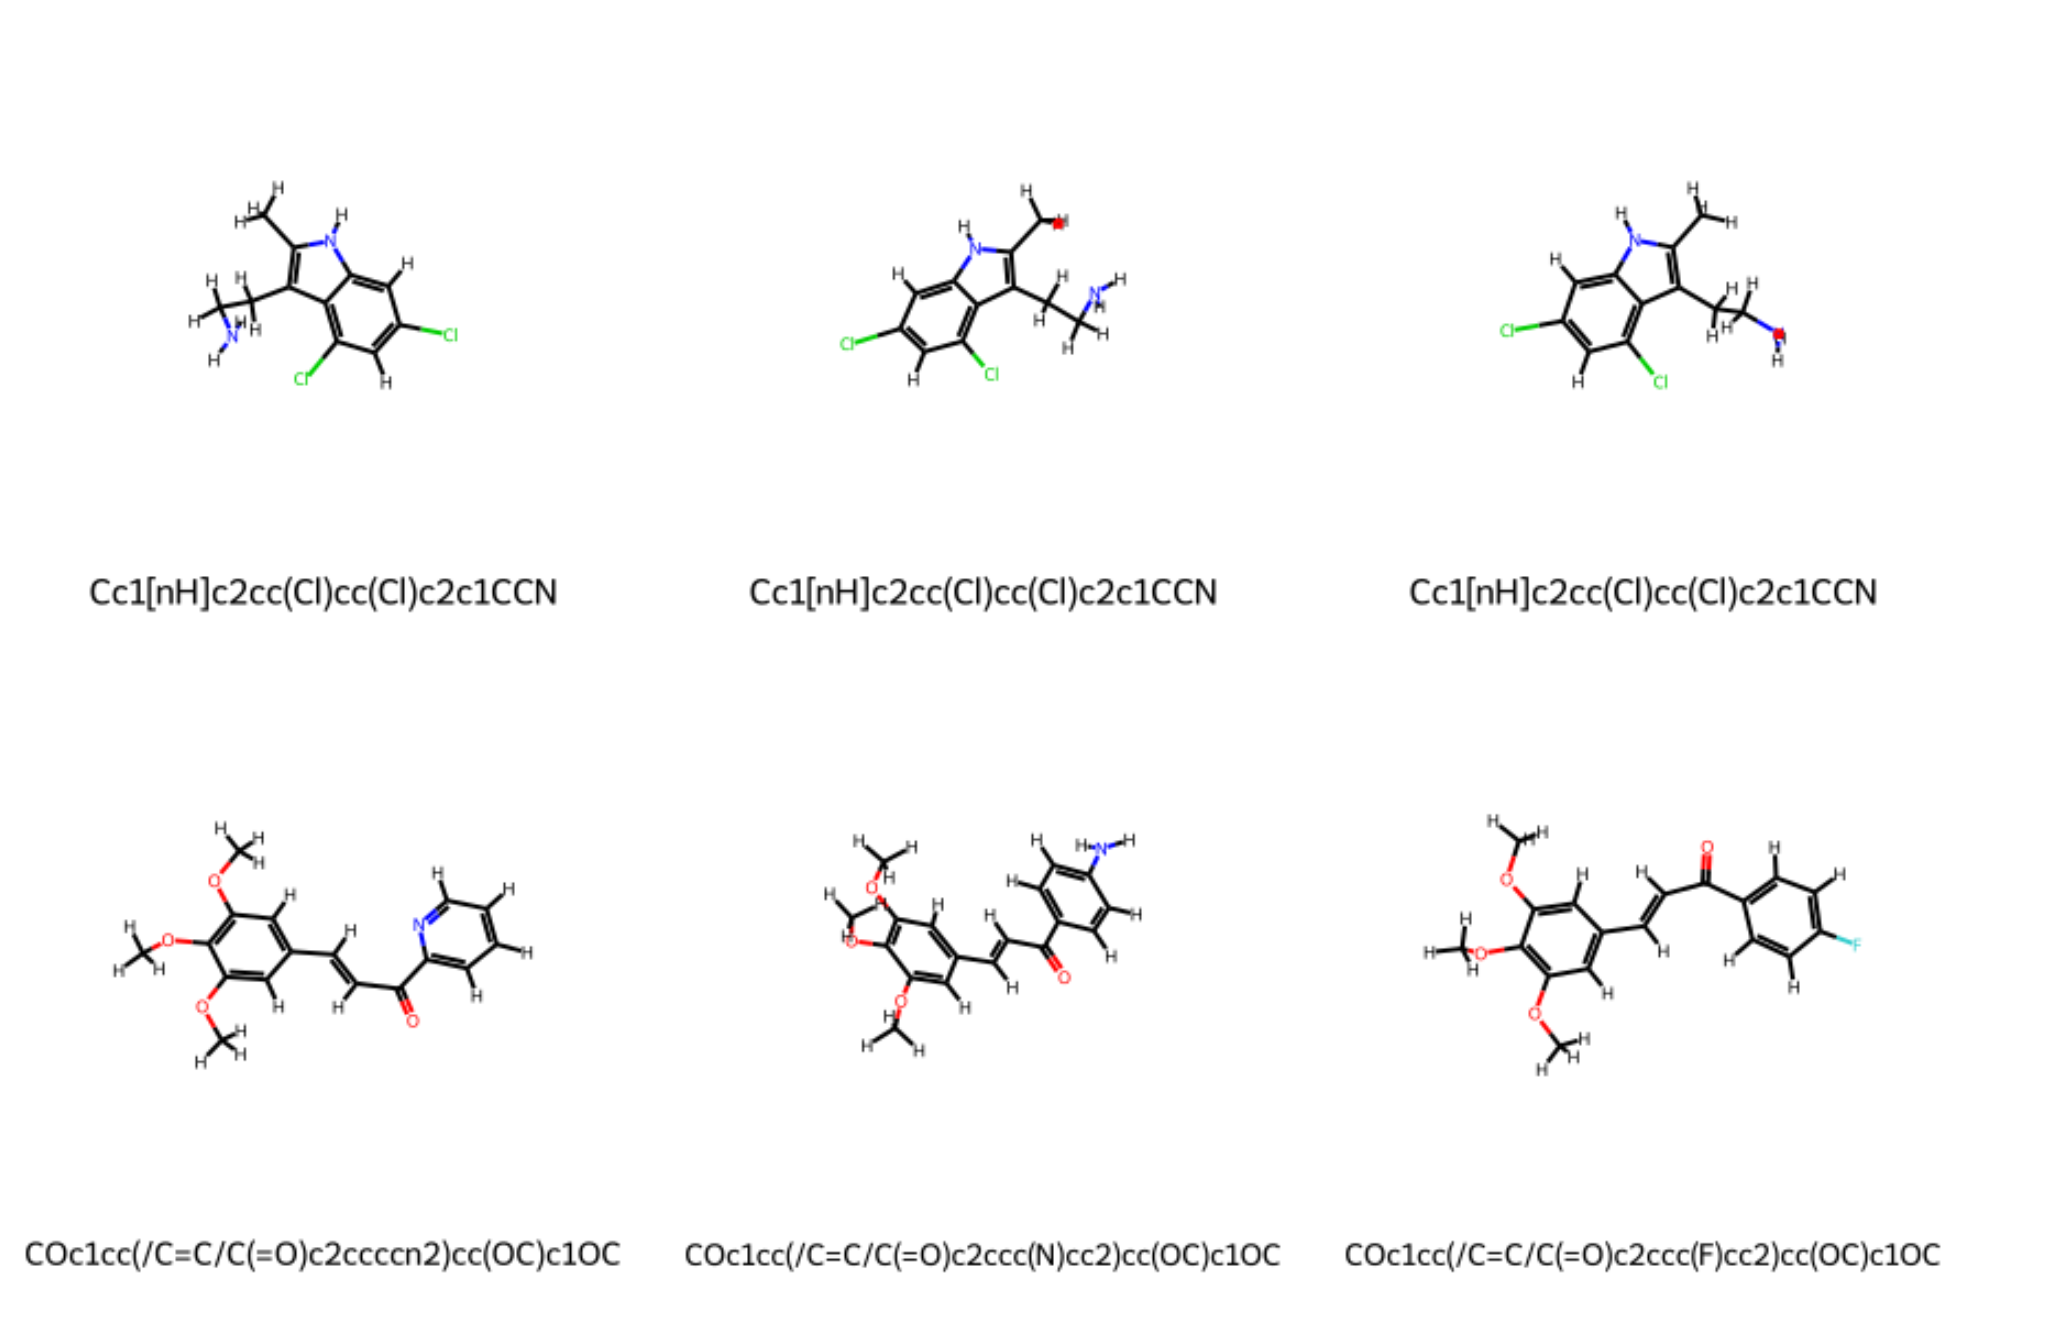
Grid view (2D)
To view a grid of all 2D structures of all ligands in the LigandSet, use:
from deeporigin.drug_discovery import LigandSet, DATA_DIR

ligands = LigandSet.from_sdf(DATA_DIR / "ligands" / "ligands-brd-all.sdf")

ligands.show_grid()
Expected Output
Operations on Ligands
Preparing Ligands
You can prepare a ligand for downstream workflows using the prepare() method. This performs salt removal, kekulization, fragment validation (rejects multiple non-identical fragments), and validates atom types:
from deeporigin.drug_discovery import Ligand

ligand = Ligand.from_smiles("c1ccccc1")
ligand.prepare(remove_hydrogens=False)  # Mutates the ligand in place, returns self for chaining
Mutation Behavior
The prepare() method mutates the ligand object in place and returns self for method chaining.
from deeporigin.drug_discovery import LigandSet, DATA_DIR

ligands = LigandSet.from_sdf(DATA_DIR / "ligands" / "ligands-brd-all.sdf")
ligands.prepare(remove_hydrogens=False)  # Prepares all ligands in place
This will call the prepare() method on each ligand in the set. The method returns the LigandSet itself for convenience, so you can chain further operations if desired.
Mutation Behavior
The prepare() method mutates all ligands in the set and returns self for method chaining.
Generating 3D Coordinates
You can generate 3D coordinates for a single ligand or all ligands in a LigandSet using the embed() method. This is useful for preparing ligands for docking or other modeling tasks that require 3D structures.
from deeporigin.drug_discovery import Ligand, BRD_DATA_DIR

ligand = Ligand.from_sdf(BRD_DATA_DIR / "brd-2.sdf")
ligand.embed()  # Generates 3D coordinates in place
Mutation Behavior
The embed() method mutates the ligand object by adding 3D coordinates to the molecule.
from deeporigin.drug_discovery import LigandSet, DATA_DIR

ligands = LigandSet.from_sdf(DATA_DIR / "ligands" / "ligands-brd-all.sdf")
ligands.embed()  # Generates 3D coordinates for all ligands in place
This will call the embed() method on each ligand in the set, updating their 3D coordinates. The method returns the LigandSet itself for convenience, so you can chain further operations if desired.
Mutation Behavior
The embed() method mutates all ligands in the set and returns self for method chaining.
Constructing a network using Konnektor
To run RBFE, it is helpful to map out a network within the ligand set, so that we can run RBFE on those pairs of ligands. Use the Konnektor platform tool:
from deeporigin.drug_discovery import Konnektor

# assuming ligands is a LigandSet with at least two ligands
result = Konnektor(ligands=ligands).run()
result.show_network()
pairs = result.pairs
result.pairs is a list of (ligand1, ligand2) tuples suitable for RBFE. The visualization is similar to:
Predicting ADMET Properties
ADMET (Absorption, Distribution, Metabolism, Excretion, and Toxicity) properties can be predicted for Ligands or LigandSets.
Use :class:~deeporigin.drug_discovery.molprops.Molprops to predict ADMET properties for one or more ligands:
from deeporigin.drug_discovery import Molprops

mp = Molprops(ligands=[ligand])
mp.run(quote=True)  # optional: platform quote for all ligands → mp.estimate
mp.run()  # mutates ligands; total USD in mp.cost when available

# Or request only some models (keys match platform suffixes: ames, logp, logd, …):
mp = Molprops(ligands=[ligand], props=["ames", "logp"])
mp.run()
For many ligands, pass batch_size (e.g. 10) so each run request sends at most that many molecules per API call. Omit it (default) to send all ligands in a single combined-tool call.
run(quote=True) requests a single platform quotation for every ligand and every selected property in one call (batch_size is ignored). It populates estimate (and execution id / status via the tools DTO) and does not mutate ligands with predictions.
Mutation Behavior
Molprops.run() mutates each ligand by filling dedicated ADMET attributes (see below), storing values in ligand.properties, and setting RDKit molecule properties.
The return value is a single flat dict (one row per ligand), for example:
{
    'ligand_id': '0',
    'logS': -4.004,                       # Aqueous solubility
    'logP': 3.686,                        # Partition coefficient
    'logD': 2.528,                        # Distribution coefficient
    'ames_probability': 0.213,            # Ames mutagenicity probability
    'herg_inhibition_probability': 0.264, # hERG inhibition probability
    'cyp1a2': 0.134,                      # CYP450 inhibition probabilities
    'cyp2c9': 0.744,
    'cyp2c19': 0.853,
    'cyp2d6': 0.0252,
    'cyp3a4': 0.4718,
    'has_pains': False,                   # PAINS (Pan Assay Interference Compounds)
    'pains_fragments': [],
}
The same values are exposed as first-class attributes (Python snake_case names):
API key (in dict / get_property) |
Ligand attribute |
|---|---|
logS |
ligand.log_s |
logD |
ligand.log_d |
logP |
ligand.log_p |
ames_probability |
ligand.ames_probability |
herg_inhibition_probability |
ligand.herg_inhibition_probability |
cyp1a2 |
ligand.cyp_1a2 |
cyp2c9 |
ligand.cyp_2c9 |
cyp2c19 |
ligand.cyp_2c19 |
cyp2d6 |
ligand.cyp_2d6 |
cyp3a4 |
ligand.cyp_3a4 |
has_pains |
ligand.has_pains |
pains_fragments |
ligand.pains_fragments |
You can read predictions from attributes or from the properties bag:
log_p = ligand.log_p
log_p = ligand.get_property('logP')
Pass a LigandSet (or a list of ligands) to Molprops. A tqdm progress bar appears only when batch_size is set so that more than one API batch runs; it tracks ligands completed and shows ligands/s.
from deeporigin.drug_discovery import LigandSet, Molprops, DATA_DIR

ligands = LigandSet.from_csv(
    file_path=DATA_DIR / "ligands" / "ligands.csv",
    smiles_column="SMILES"
)

Molprops(ligands=ligands).run()
The same batch_size and run(quote=True) behavior as in the single-ligand tab applies.
Mutation Behavior
Molprops.run() mutates each ligand by filling the same dedicated ADMET attributes and .properties as the single-ligand case.
The properties are stored on each ligand (attributes and .properties) for later access.
To view ADMET properties of all ligands in the ligand set, simply view the ligandset as a dataframe using:
ligands
or, optionally, convert to a DataFrame for further analysis:
ligands.to_dataframe()
Predicting ADMET endpoints (Admet)
For the expanded admet-now endpoint set (59 absorption, distribution, metabolism,
excretion, and toxicity models), use :class:~deeporigin.drug_discovery.admet.Admet.
Unlike :class:~deeporigin.drug_discovery.molprops.Molprops, Admet.run() returns a
:class:pandas.DataFrame and does not mutate your ligands in place.
Property names match the platform tool keys (for example hERG_classification,
PPB_regression, CYP450_3A4_Inhibitor_classification). Omit properties
to request all wired endpoints, or pass a list to limit the run.
Use method="togo" (default) for three-dimensional embedding models, or
method="maplight" for fingerprint-based models:
from deeporigin.drug_discovery import Admet, Ligand

ligand = Ligand.from_smiles("CCO")
df = Admet(
    ligands=[ligand],
    properties=["hERG_classification", "AMES_classification"],
).run()
For MapLight explicitly:
df = Admet(
    ligands=[ligand],
    properties=["hERG_classification", "AMES_classification"],
    method="maplight",
).run()
run() blocks until the job finishes. Request a cost estimate first with
run(quote=True); the job's estimate and execution status are updated
from the platform response.
For several ligands, pass a list or :class:~deeporigin.drug_discovery.structures.ligand.LigandSet:
from deeporigin.drug_discovery import Admet, LigandSet

df = Admet(ligands=ligands, properties=["hERG_classification"]).run()
The DataFrame includes ligand_id, smiles, and one column per requested
property. Classification endpoints are probabilities in [0, 1]; regression
endpoints use the model's native units.
Random Sampling
You can randomly sample ligands from a LigandSet using the random_sample method:
from deeporigin.drug_discovery import LigandSet, DATA_DIR

ligands = LigandSet.from_sdf(DATA_DIR / "ligands" / "ligands-brd-all.sdf")

# Sample 5 random ligands
sample = ligands.random_sample(5)
Creates New Object
The random_sample() method creates a new LigandSet containing copies of the sampled ligands. The original LigandSet is not modified.
Maximum Common Substructure
The Maximum Common Substructure (MCS) for a LigandSet can be computed as follows:
from deeporigin.drug_discovery import BRD_DATA_DIR, LigandSet

ligands = LigandSet.from_dir(BRD_DATA_DIR)
mcs_smarts = ligands.mcs()  # Returns a SMARTS string
Returns New Data
The mcs() method returns a SMARTS string representing the maximum common substructure. It does not mutate the LigandSet or its ligands.
Expected Output
Computing RMSD
You can compute pairwise RMSD (Root Mean Square Deviation) between all ligands in a LigandSet:
from deeporigin.drug_discovery import LigandSet

ligands = LigandSet.from_sdf("docking_results.sdf")
rmsd_matrix = ligands.compute_rmsd()  # Returns a numpy array
Returns New Data
The compute_rmsd() method returns a numpy array containing pairwise RMSD values. It does not mutate the LigandSet or its ligands.
Plotting Ligands
You can create scatter plots of ligands using their properties:
from deeporigin.drug_discovery import LigandSet

ligands = LigandSet.from_sdf("docking_results.sdf")
ligands.plot(
    x="POSE SCORE",
    y="Binding Energy",
    x_label="Pose Score",
    y_label="Binding Energy (kcal/mol)"
)
Visualization Only
The plot() method creates a visualization and optionally saves it to a file. It does not mutate the LigandSet or its ligands.
Constraints
Ligands in a LigandSet can be aligned to a reference ligand using:
from deeporigin.drug_discovery import BRD_DATA_DIR, LigandSet

ligands = LigandSet.from_dir(BRD_DATA_DIR)
constraints = ligands.compute_constraints(reference=ligands[1])
Returns New Data
The compute_constraints() method returns a list of constraint dictionaries. It does not mutate the LigandSet or its ligands.
Protonation
You can protonate ligands at a specific pH. This is useful for preparing ligands for molecular dynamics simulations or other pH-dependent calculations. Use the Protonation class from deeporigin.drug_discovery: pass exactly one of smiles, ligand, or ligands (a LigandSet with a single ligand), a ph, and a DeepOriginClient (see Clients). Call run() to execute; it returns a LigandSet whose ligands list holds the protonated species (most abundant first).
from deeporigin.drug_discovery import Ligand, Protonation
from deeporigin.platform.client import DeepOriginClient

client = DeepOriginClient()
ligand = Ligand.from_smiles("c1ccccc1")
result = Protonation(ligand=ligand, ph=7.4, client=client).run()
result.ligands  # [ligand] — the protonated ligand (same instance, updated)
Mutation Behavior
When you pass ligand= or a one-ligand ligands=, run() updates the primary Ligand in place (mol, smiles, protonated_at_ph). Additional protonation states, if any, are new Ligand instances appended after the first.
The protonated_at_ph attribute (default: None) can be used to track the pH value at which a ligand was protonated. This attribute stores a float value representing the pH.
To get a cost estimate without running protonation:
job = Protonation(ligand=ligand, ph=7.4, client=client)
job.quote()
job.estimate  # cost in dollars
Protonation runs one input structure per job. Protonate each member of a LigandSet in a loop (each call uses the same client):
from deeporigin.drug_discovery import LigandSet, Protonation
from deeporigin.platform.client import DeepOriginClient

client = DeepOriginClient()
ligands = LigandSet.from_smiles(["c1ccccc1", "CCO"])
for lig in ligands:
    Protonation(ligand=lig, ph=7.4, client=client).run()
Mutation Behavior
Each Protonation(...).run() mutates the corresponding Ligand when constructed with ligand= as above.
Adding Hydrogens
You can add hydrogens to ligands, which is often necessary before generating 3D coordinates or performing certain calculations.
from deeporigin.drug_discovery import Ligand

ligand = Ligand.from_smiles("c1ccccc1")
ligand.add_hydrogens()  # Mutates the ligand in place
Mutation Behavior
The add_hydrogens() method mutates the ligand object by adding hydrogens to self.mol.
from deeporigin.drug_discovery import LigandSet

ligands = LigandSet.from_smiles(["c1ccccc1", "CCO"])
ligands.add_hydrogens()  # Mutates all ligands in place
Mutation Behavior
The add_hydrogens() method mutates all ligands in the set by calling add_hydrogens() on each ligand.
Exporting ligands
To SDF files
To write a Ligand to a SDF file, use:
from deeporigin.drug_discovery import Ligand

ligand = Ligand.from_smiles("NCCc1c[nH]c2ccc(O)cc12")
ligand.to_sdf()
Platform ligands without a local file
If the ligand was loaded with from_id(..., download=False), it has remote_path
but no local file yet. Call download(client=...) before to_sdf() or to_file(),
or use from_id(..., download=True).
To write a LigandSet to a SDF file, use:
from deeporigin.drug_discovery import LigandSet

smiles = {
"C/C=C/Cn1cc(-c2cccc(C(=O)N(C)C)c2)c2cc[nH]c2c1=O",
"C=CCCn1cc(-c2cccc(C(=O)N(C)C)c2)c2cc[nH]c2c1=O",
}

ligands = LigandSet.from_smiles(smiles)
ligands.to_sdf()
Remote paths without local files
If some ligands have remote_path set but local_path is unset (for example
poses from LigandSet.from_docking_results), call
ligands.download(client=...) before to_sdf(). That fetches each pose SDF
and reloads the RDKit mol from disk so 3D coordinates match the file (not
the placeholder 2D structure built from SMILES when the pose was created).
To mol files
To write a ligand to a mol file, use:
from deeporigin.drug_discovery import Ligand

ligand = Ligand.from_smiles("NCCc1c[nH]c2ccc(O)cc12")
ligand.to_mol()
To PDB files
To write a ligand to a PDB file, use:
from deeporigin.drug_discovery import Ligand

ligand = Ligand.from_smiles("NCCc1c[nH]c2ccc(O)cc12")
ligand.to_pdb()
To Pandas DataFrames
To convert a LigandSet to a Pandas DataFrame, use:
from deeporigin.drug_discovery import LigandSet, DATA_DIR

ligands = LigandSet.from_csv(
    file_path = DATA_DIR / "ligands" / "ligands.csv",
    smiles_column="SMILES"  # Optional, defaults to "smiles"
)
df = ligands.to_dataframe()
To CSV files
To write a LigandSet to a CSV file, use method chaining:
# we're using pandas' native to_csv method here

ligands.to_dataframe().to_csv("temp.csv")